Follow us


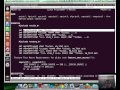
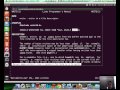
Description: In this video I will show you how to use Volatility Process Memory & Kernel Memory and Objects plugging usage, I will cover how to dump Process exe and Kernel Memory.
Plugging are used
• Process Memory
o memmap
o memdump
o procmemdump
o procexedump
o vadwalk
o vadtree
o vadinfo
o vaddump
• Kernel Memory and Objects
o modules
o modscan
o moddump
o ssdt
o driverscan
o filescan
o mutantscan
o symlinkscan
o thrdscan
memmap
For a brief inspection of the addressable memory pages in a process
memdump
To extract all data from the various memory segments in a process and dump them to a single file
procmemdump
To dump a process's executable (including the slack space), use the procmemdump command.
procexedump
To dump a process's executable
vadwalk
To briefly inspect a process's VAD nodes
vadtree
To display the VAD nodes in a visual tree form
vadinfo
The vadinfo command displays extended information about a process's VAD nodes
vaddump
To extract the data contained within each VAD segment
Kernel Memory and Objects
modules
To view the list of kernel drivers loaded on the system
modscan
To scan physical memory for kernel modules, use the modscan command
moddump
To extract a kernel driver to a file
ssdt
To list the functions in the Native and GUI SSDTs
driverscan
To scan for DRIVER_OBJECTs in physical memory
filescan
To scan physical memory for FILE_OBJECTs
mutantscan
To scan physical memory for KMUTANT objects
symlinkscan
This plugin scans for symbolic link objects and outputs their information.
thrdscan
To scan for ETHREAD objects in physical memory
Source : - http://code.google.com/p/volatility/wiki/CommandReference#memmap
Tags: hacking , memory , forensics , kernel-memory ,
Disclaimer: We are a infosec video aggregator and this video is linked from an external website. The original author may be different from the user re-posting/linking it here. Please do not assume the authors to be same without verifying.
Comments:
Login to post a comment

-
 Defeating Getimagesize() Checks In File Uploads
-
 Challenge 6: Digest Authentication Reloaded
-
 Challenge 5: Digest Authentication Attack
-
 Basic Authentication And Form Bruteforcing
-
 Http Basic Authentication Attack (Easy)
-
 Challenge 2: Http Form Attacks Reloaded
-
 Http Verb Tampering Demo
-
 Web Application Pentesting Course Introduction
-
 Introducing Pentester Academy
-
 Hack Of The Day 13: Remote Shellcode Launcher: Testing Shellcode Over A Network
-
 Hack Of The Day 12: Pivots And Port Forwards In Scenario Based Pentesting
-
 Hack Of The Day: Customizing Shellcode For Fun And Profit
-
 Hack Of The Day: How Do I Run Untrusted Shellcode?
-
 Securitytube Linux Assembly Expert Exam Format
-
 [Slae] Writing An Custom Insertion Encoder
-
 [Slae] Execve Shellcode Stack Method
-
 [Slae] Shellcoding Basics
-
 [Slae] Using Libc And Nasm
-
 [Slae] Hello World In Assembly Language
-
 [Slae] What Is Assembly Language?